07 / ApplicationsWindows event monitoringBring important Event Viewer activity into your investigation.+
What you can track and manage
Application, System and security-related events
Critical events, errors and warnings
Search event history and filter by severity
Identify recurring errors across monitored servers
08 / MonitoringServer availability & uptimeUnderstand both the current connection and its history.+
What you can track and manage
Continuous heartbeats and unreachable-server detection
Offline duration, uptime percentage and last successful communication
Server restart and unexpected shutdown detection
Availability history for reviewing interruptions
09 / AlertsAlert managementDefine which conditions matter and follow them through recovery.+
What you can track and manage
Server offline, agent disconnected and network failure alerts
High CPU, high memory and low disk-space alerts
Stopped services, critical Windows events and server reboot alerts
Information, Warning, Critical and Recovery severity levels
10 / AlertsEmail notificationsSend issue and recovery information directly to your team.+
What you can track and manage
Automatic email notifications when monitored problems occur
Include the server, affected resource, measured value and threshold
Recovery messages when a server responds normally again
Use configured recipients and email delivery settings
11 / AlertsWhatsApp notificationsSupport critical-event messaging through a configured WhatsApp integration.+
What you can track and manage
Notifications for offline servers, critical disk space and high CPU
Alerts when an important service stops
Restoration messages when service resumes
WhatsApp alert delivery depends on the configured messaging integration
12 / MonitoringCentral monitoring dashboardMove from the whole estate to the servers that need a closer look.+
What you can track and manage
Total servers with Online, Offline, Warning and Critical counts
Average CPU and RAM, low disk space and failed services
Recent alerts and the latest critical events
Server uptime and overall system health in a single dashboard
13 / MonitoringServer health indicatorsRead overall health without checking every metric individually.+
What you can track and manage
Healthy, Warning, Critical and Offline indicators
Health assessment using CPU, RAM, storage, services and connectivity
Active alerts contribute to the overall view
A numeric health-score presentation can be configured for your setup
14 / ReportingHistorical performanceCompare trends and investigate what changed over time.+
What you can track and manage
CPU, memory, disk usage and network activity charts
Server availability and alert-frequency trends
Review 24-hour, 7-day, 30-day or custom periods
Available history depends on collection and retention settings
15 / AlertsAlert historyKeep the context of an incident from detection to resolution.+
What you can track and manage
Server, alert, severity and current status
First detected, last detected and recovery time
Incident duration and acknowledgement details
Review recurring conditions and the history of resolved issues
16 / InventoryServer inventoryKeep essential machine information close to its health data.+
What you can track and manage
Hostname, manufacturer, model and serial number
Operating system, Windows version / build and system architecture
CPU, RAM, storage and network adapters
IP addresses, MAC addresses and last boot time
17 / InventorySoftware inventorySupport server audits and application lifecycle reviews.+
What you can track and manage
Installed application names and versions
Software publishers and installation dates
Review the software present on each server
Use inventory details during audits and upgrade planning
18 / InventoryWindows update statusSee update activity and the restarts it leaves behind.+
What you can track and manage
Last Windows Update and installed updates
Pending updates and update failures
Reboot-required status and server patch status
Status views such as Fully Updated, Updates Available and Reboot Required
19 / AdministrationRemote server actionsGive authorized administrators tools to respond from one place.+
What you can track and manage
Restart or shut down a server
Start, stop or restart a monitored service
Refresh the monitoring agent or force a health check
Confirmation dialogs and audit logging for administrative actions
20 / ApplicationsIIS monitoringWatch the Windows web stack and its application components.+
What you can track and manage
IIS service health and website status
Application pool status
Authorized start, stop and recycle actions for application pools
Website availability and HTTP response monitoring
21 / ApplicationsDatabase monitoringAdd database-level visibility where your deployment needs it.+
What you can track and manage
Optional monitoring for systems such as SQL Server
SQL service status, database availability and connection status
Database size, free space and basic health
Backup age and status through the configured database integration
22 / ApplicationsPort & application availabilityCheck whether the endpoints your applications depend on respond.+
What you can track and manage
TCP port response monitoring with custom ports
HTTP 80, HTTPS 443 and SQL Server 1433
RDP 3389, DICOM 104 and HL7 2575
Associate endpoint checks with the relevant server or application
23 / ApplicationsWebsite & URL monitoringFollow availability for internal and public web endpoints.+
What you can track and manage
HTTP / HTTPS availability
Response time and HTTP status code
SSL connectivity checks
Website downtime alerts
24 / ApplicationsSSL certificate monitoringGet advance notice before a certificate expires.+
What you can track and manage
Certificate name and expiry date
Days remaining until expiration
Configurable expiry-warning threshold
Example: notify the team when a certificate has 14 days remaining
25 / ApplicationsProcess monitoringTrack required processes and the resources they consume.+
What you can track and manage
Process name and Running / Not running status
Per-process CPU and memory consumption
Process start time
Alerts when a required process stops
26 / ApplicationsScheduled task monitoringSpot failed or missed Windows Task Scheduler jobs.+
What you can track and manage
Task status and last run time
Next scheduled run and last result
Failed-task alerts
Missed scheduled-task detection
27 / ApplicationsBackup monitoringKeep backup freshness visible alongside server health.+
What you can track and manage
Last successful and last failed backup
Backup age and current status
Configure the allowed period between completed backups
Alert when a backup has not completed within that period
28 / AdministrationServer groupsOrganize infrastructure in the way your team works.+
What you can track and manage
Group by Production, Development, Database or Web Server
Organize PACS and application servers
Group by branch, customer or location
Use groups to make larger server estates easier to navigate
29 / AdministrationUser & role managementAlign access with each person’s operational responsibilities.+
What you can track and manage
Administrator: full control
Engineer: monitoring and approved actions
Viewer: monitoring access
Manage team members and role-based access
30 / AdministrationAudit trailKeep a record of administrative activity.+
What you can track and manage
Login and logout activity
Server and service restarts
Configuration changes and alert acknowledgements
User changes and threshold modifications
31 / ReportingReportsTurn monitoring information into a useful operational record.+
What you can track and manage
Server health, availability and CPU / memory performance reports
Disk capacity, Windows Update and alert reports
Service availability, inventory and monthly health reports
PDF, Excel and CSV export options depend on the configured report workflow
32 / ReportingScheduled reportsKeep regular reviews on the calendar.+
What you can track and manage
Daily, weekly and monthly report schedules
Automatic report generation
Email delivery to configured recipients
Use recurring summaries for operational and customer reviews
33 / AlertsMaintenance modeKeep planned work from creating unnecessary notifications.+
What you can track and manage
Suppress alerts during server maintenance or patching
Cover planned shutdowns and application upgrades
Set an end time for the maintenance window
Example: hold maintenance notifications until 02:00 AM
34 / AlertsCustom monitoring thresholdsTune alert sensitivity to the role of each server.+
What you can track and manage
Per-server CPU, memory and disk-free thresholds
Response time, service status and offline timeout settings
Separate warning and critical levels
Example: CPU warning at 80% and critical at 95%
35 / AdministrationMulti-server & multi-site monitoringBring distributed infrastructure into one console.+
What you can track and manage
Main offices, branches and data centres
Customer sites and cloud environments
Monitor multiple servers across locations
Support internal IT teams and managed service providers
36 / AdministrationSecure agent architectureConnect monitored Windows servers to central health reporting.+
What you can track and manage
A Windows agent sends health information to the central ServerPulse server
Background monitoring independent of the local dashboard
HTTPS reporting and protected local configuration
A lightweight collection approach designed for routine server monitoring
37 / ReportingData retentionKeep monitoring history for the review periods you need.+
What you can track and manage
Configurable historical data retention
Periods such as 30, 90, 180 or 365 days
Align retention with reporting and investigation needs
Available retention depends on your deployment configuration
38 / AdministrationSearch & filteringFind the right server without working through the whole estate.+
What you can track and manage
Search by hostname, IP address and operating system
Find servers by group or location
Filter Healthy, Warning, Critical and Offline states
Combine search and status filters to focus your review
No matching features
Try a different term or choose another category.
Monitoring coverage depends on the sources, integrations and permissions configured for your deployment. Talk to our team about the capabilities your environment needs.
A useful alert tells your team which server needs attention, what changed and why it matters. Pair clear thresholds with recovery messages to follow the full incident.
Detect the conditionWatch resource thresholds, server heartbeats and essential services.
Reach the right peopleSend email notifications and support critical-event messaging through a configured WhatsApp integration.
Close the loopRecord the recovery and review the incident history. Suppress notifications during planned maintenance.
ILLUSTRATIVE NOTIFICATIONS · SAMPLE DATA
CRITICAL / DISK SPACE
SQL-PROD-01 needs attention
Resource
Drive C:
Remaining space
7%
Warning threshold
10%
Check disk usage and available capacity.
RECOVERY / SERVER AVAILABLE
SQL-PROD-01 is responding
The server is communicating normally again. Review its current health and incident history in ServerPulse.
Examples explain notification content; they are not live alerts.
BUILT AROUND YOUR ENVIRONMENT
Different systems. Shared visibility.
01 / INTERNAL IT
Offices, branches & data centres
Group servers by location and role. Review uptime, capacity, updates and backup freshness from a central workspace.
02 / APPLICATION TEAMS
Web & database workloads
Connect CPU and memory trends with IIS, SQL services, process checks, URLs and certificate expiry.
03 / HEALTHCARE IT
PACS, DICOM & HL7 services
Monitor the Windows services and configured ports supporting clinical applications, with server and log context close at hand.
04 / SERVICE PROVIDERS
Multiple customer environments
Organize customer sites, assign team access, tune thresholds and share scheduled operational reports.
A CLOSER LOOK
Your operation, on screen.
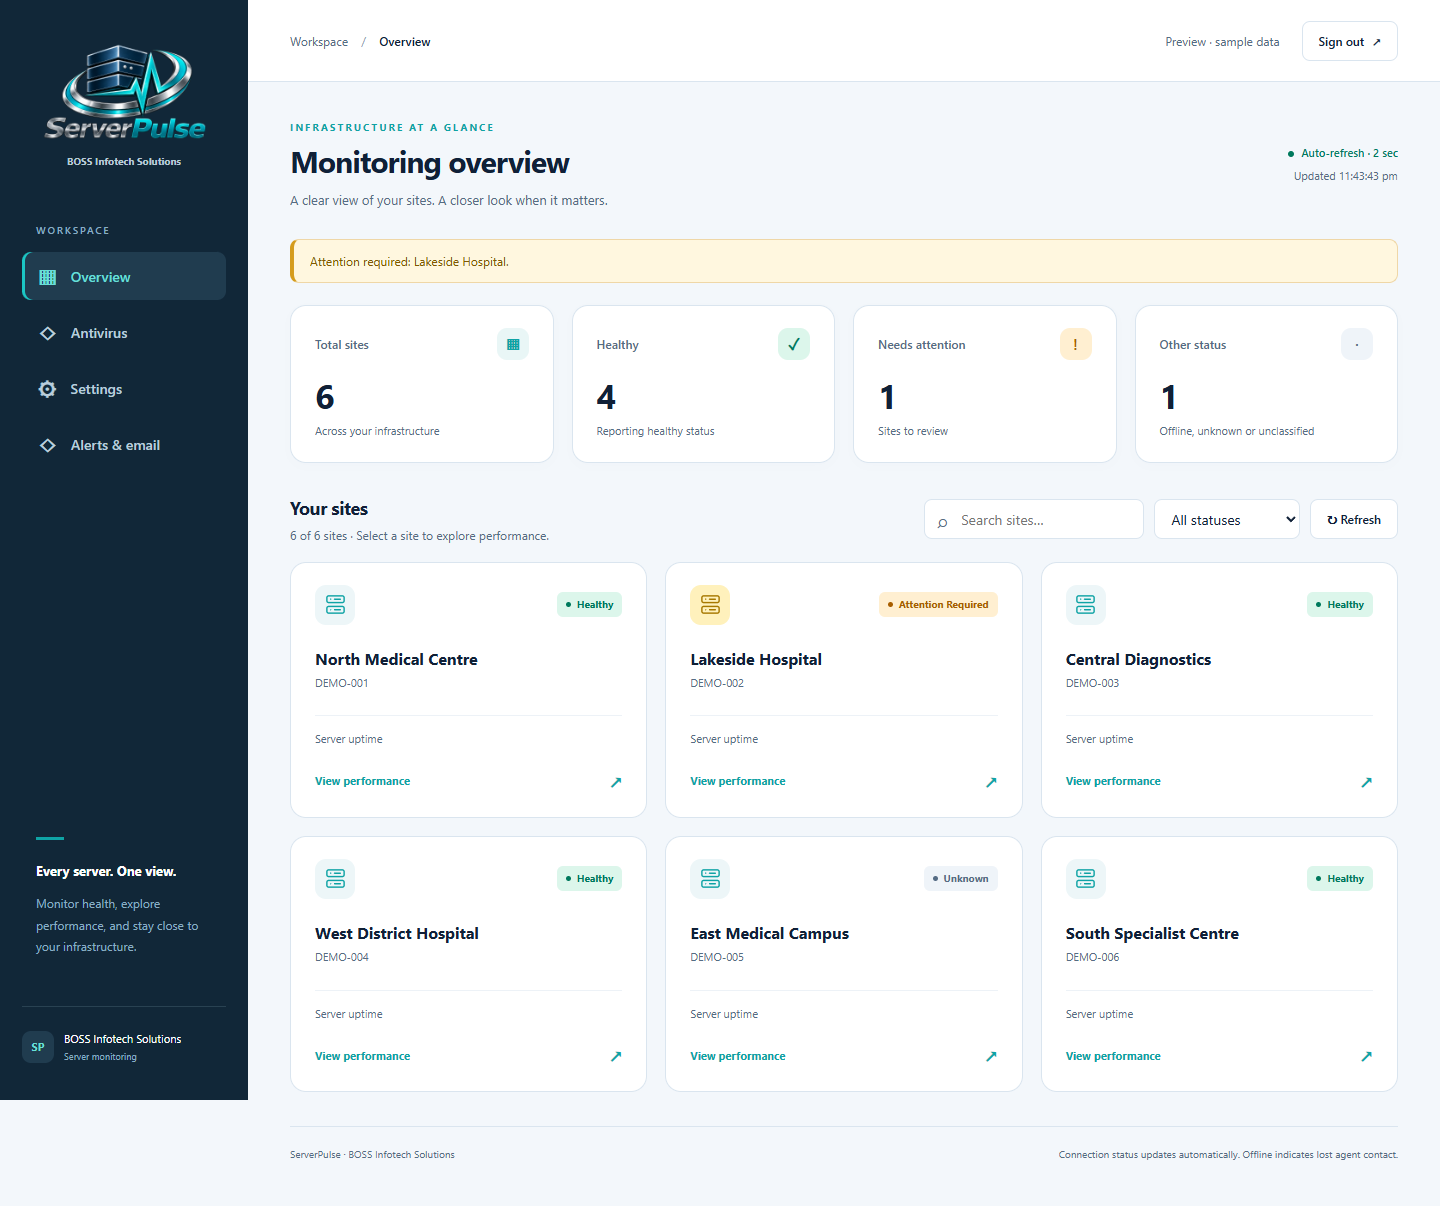
Explore actual ServerPulse application screens. These previews use sample data.
All your sites, their health and their uptime in one workspace.Open image to enlarge ↗
CENTRALIZED LOG READING
Every log has a story. Connect it to its server.
Bring server and application logs into a central view. Link configured log sources to the machine they belong to, so troubleshooting starts with the right context.
01Connect your application sourcesBring together configured application and server log sources.
02Keep the server in contextAssociate log records with a server and application.
03Read events in one placeFollow application activity alongside your infrastructure view.
CENTRAL LOG VIEW Illustrative example
▤
SP-SERVER-01Head Office / Application server
Linked
ApplicationWeb serverWindows events
INFOApplication service started
INFOConnection established
WARNRequest exceeded timeout
INFORequest completed after retry
Server → Application → Event context
FROM MACHINE TO MONITORING
A connected view, from the ground up.
01
Set up your agent
Install the Windows agent and configure the services and resources you want to monitor.
02
Connect your site
Set the server identity, activate reporting and connect the agent to your licensed site.
03
See the full picture
Review health, performance, security activity and reports through the central portal.
LET’S TALK SERVERPULSE
Bring clarity to your infrastructure.
Tell us about your servers, sites and applications. Let’s find the right monitoring setup for your team.